Landing graph links commits to shipped updates
The Open and Transparent section on the homepage now connects repository activity to what actually shipped in the product.
Hover a week on desktop—or open a month on mobile—to see commit totals, Lines added and Lines deleted when GitHub code-frequency data is available, and Product updates that link straight to the matching changelog entry. When a period has no linked post yet, Browse the changelog still takes you to the full updates timeline.
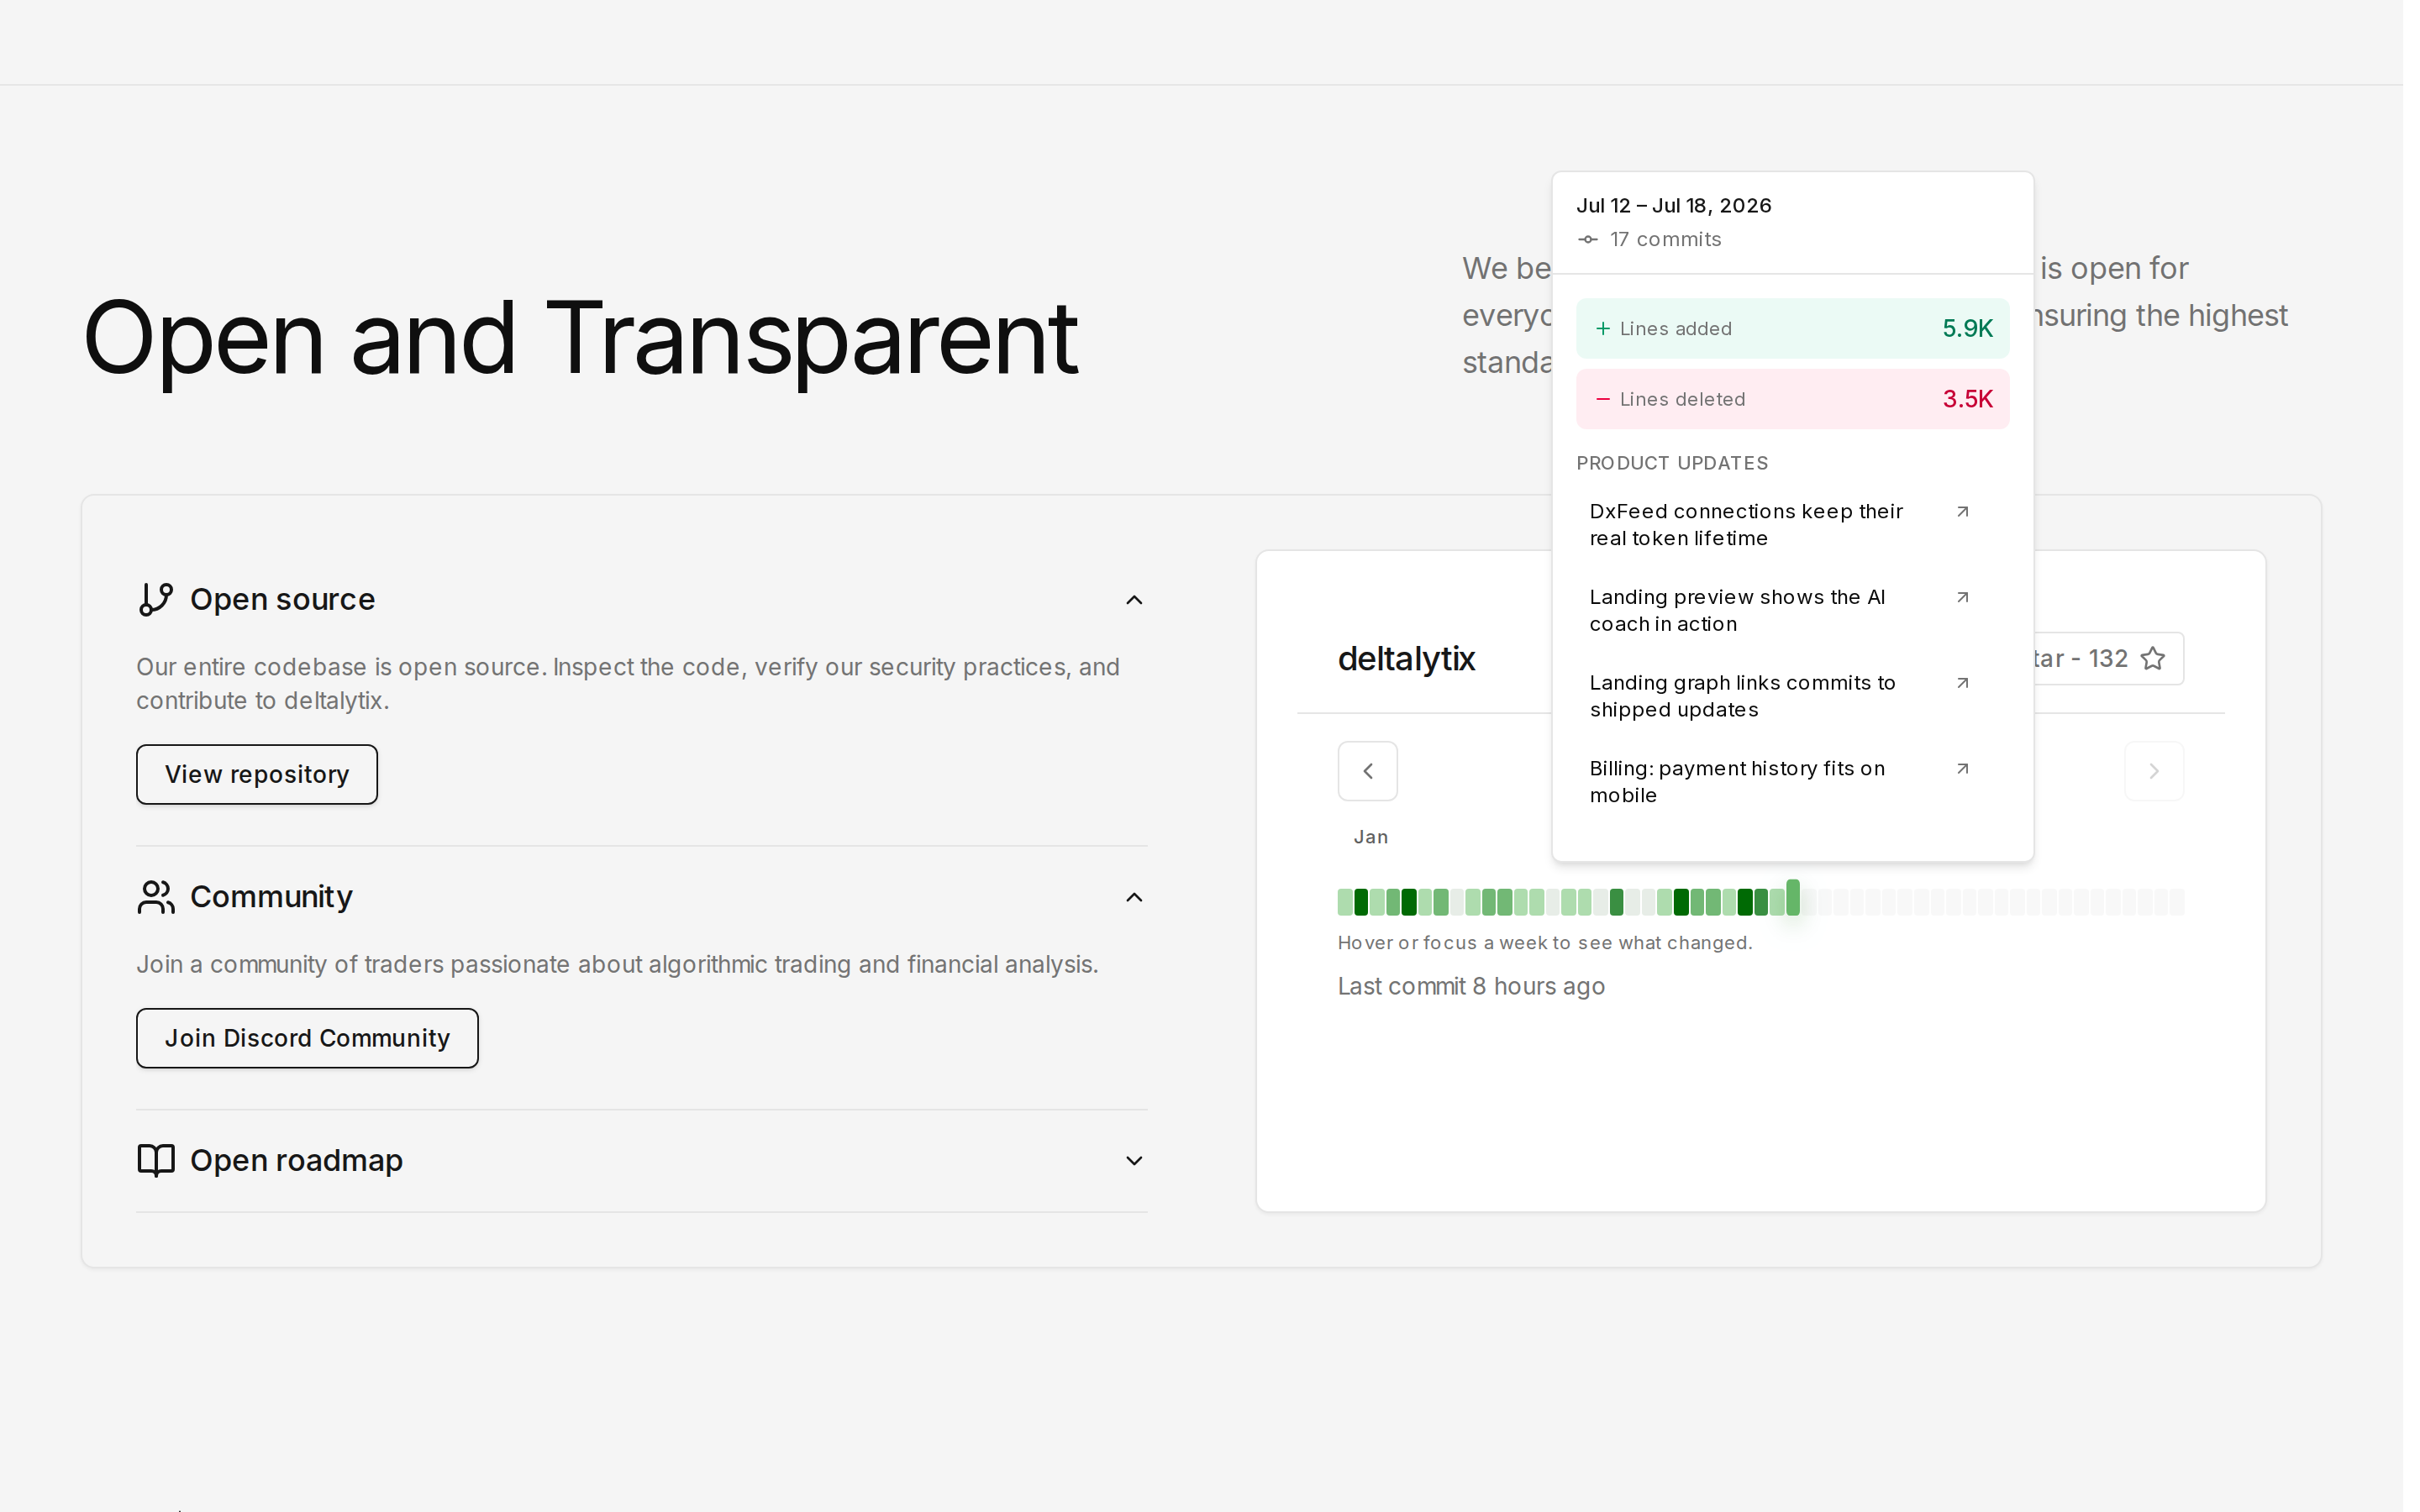
This builds on the weekly activity graph introduced earlier: you can still move between years and compare activity on main and beta, but it is now easier to see what development work turned into user-facing releases.
Explore the open-source section on the homepage.